|
eValid™ -- Automated Web Quality Solution
Browser-Based, Client-Side, Functional Testing & Validation,
Load & Performance Tuning, Page Timing, Website Analysis,
and Rich Internet Application Monitoring.
|
|
eValid -- Collecting IIS Server Performance Data During Load Testing
eValid Home
Summary
This page outlines the procedure to use
when collecting IIS Server's performance data
for use during a LoadTest project.
The data about how much load the server (server complex)
is experiencing while eValid tests run is the "feedback loop"
that lets you deduce server capacity levels and identify
bottlenecks.
Background
This application note shows how to connect to the
IIS performance monitoring capability for use during
LoadTest runs.
The performance measurement capabilities of IIS
are very highly developed and include essentially
every kind and type of measurement metric.
The eValid system assumes you will have
access to and use of these types of data
during your LoadTest experimentation.
Procedure
Here are the steps to follow to make the IIS
Server's performance data available to your machine.
These steps are illustrated with screenshots
that show the kind of data that you should be seeing.
- Establish Connection To IIS Server Machine
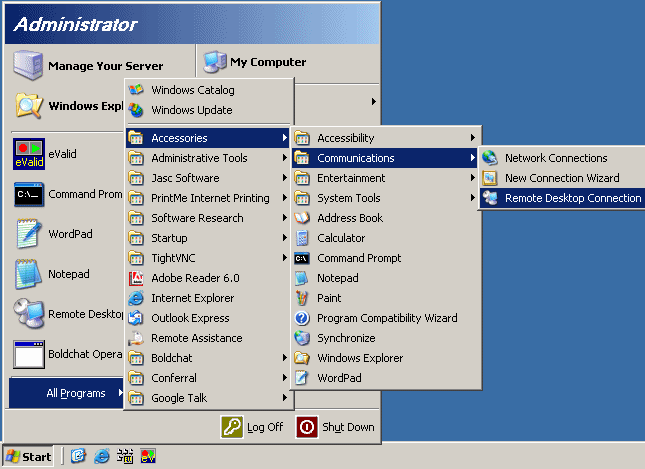
Remote log-in into server using Remote Desktop services or equivalent.
You do this using the Remote Desktop connection capability of your PC,
as illustated in this screenshot.

- Sign On To Establish Connection
This process authenticates you to the IIS machine and gives
you the ability to read the performance data.

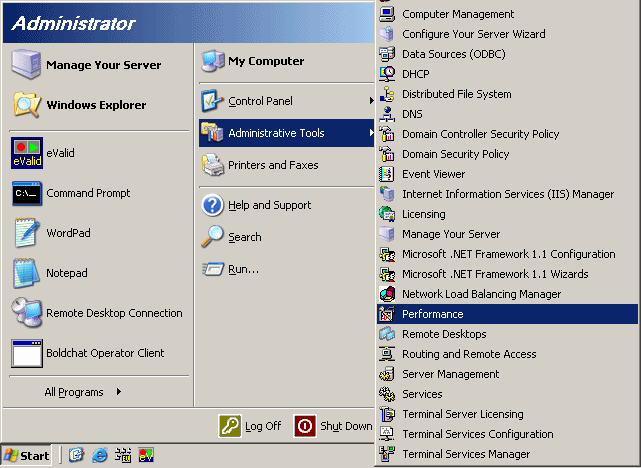
- Invoke Performance Monitor Utility.
You will find this utility under the Administrative Tools >
Performance selection from the Administrator action screen,
as shown in this screenshot.

This process invokes the IIS performance monitor,
a very powerful utility with a wide range of options of data to display.
The next three selections are typical screens of information.
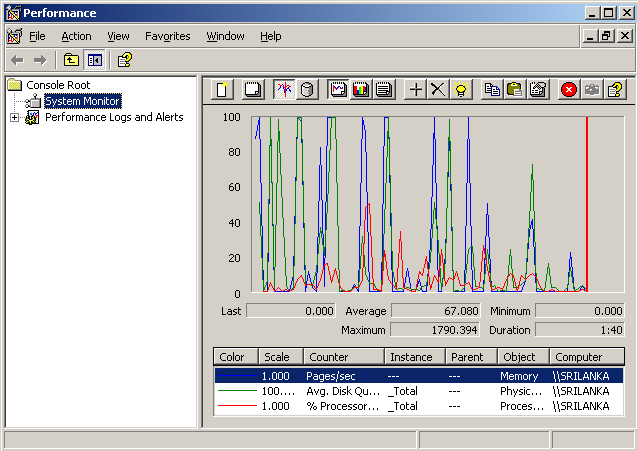
- Study Performance Data #1.
This display shows the values of three selected parameters
as a function of time.
In this example you are looking at the Pages/sec, the Average
Disk Queue size, and the percentage of processor utilization.

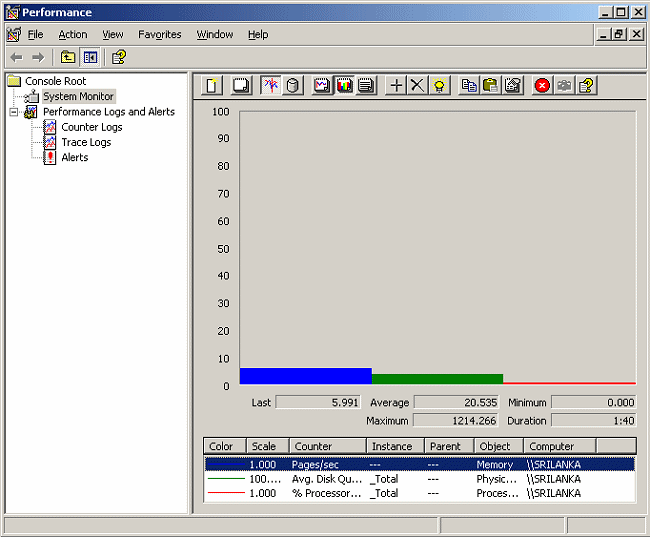
- Study Performance Data #2.
In this example screenshot you are looking at the Pages/sec,
the Average Disk Queue size,
and the percentage of processor utilization average values.

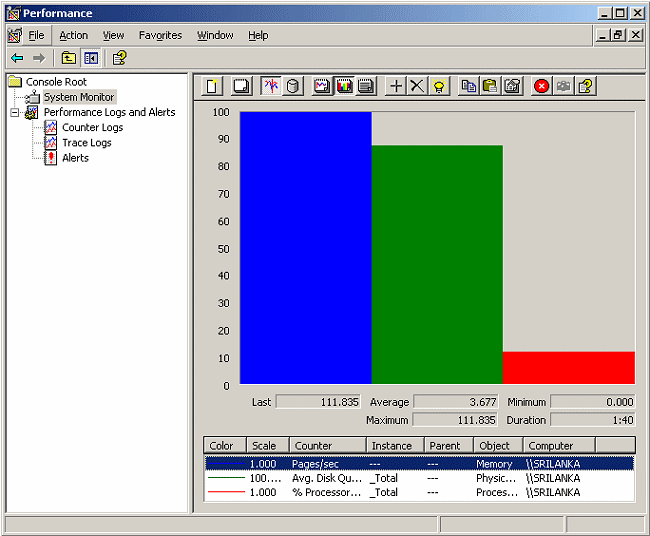
- Study Performance Data #3.
Here the same data is presented in relative terms so that you can
compare the three metrics with each other as they change.
This chart is always normalized so the highest of the selected
metrics is normalized to "100".
