|
eValid™ -- Automated Web Quality Solution
Browser-Based, Client-Side, Functional Testing & Validation,
Load & Performance Tuning, Page Timing, Website Analysis,
and Rich Internet Application Monitoring.
|
|
eValid -- Collecting LINUX Server Performance Data During Load Testing
eValid Home
Summary
This page outlines the procedure to use
when collecting LINUX Server's performance data
for use during a LoadTest project.
The data about how much load the server (server complex)
is experiencing while eValid tests run is the "feedback loop"
that lets you deduce server capacity levels and identify
bottlenecks.
Background
This application note shows how to connect to the
LINUX performance monitoring capability for use during
LoadTest runs.
The performance measurement capabilities of LINUX
are very highly developed and include essentially
every kind and type of measurement metric.
The eValid system assumes you will have
access to and use of these types of data
during your LoadTest experimentation.
Procedure
Here are the steps to follow to make the LINUX
Server's performance data available to your machine.
Example screenshots are from a PC configured with RED HAT Enterprise Linux v4.0.
These steps are illustrated with screenshots
that show the kind of data that you should be seeing.
- Establish Connection To LINUX Server Machine
Remote log-in into your server using existing configured Remote Desktop services and/or equivalent PC to X emulation/communication software.
i.e. VNC Viewer or Hummingbird EXCEED, etc.
Depending on your client/server environments, you may need to seek out
your Systems Administrator to provide the proper connection to your
LINUX Server and/or give
you the ability to read the performance data.
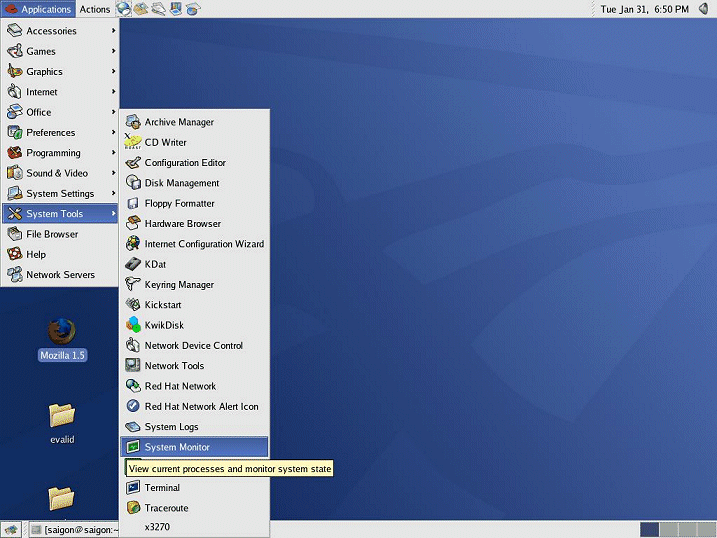
- Invoke Performance Monitor Utility.
You will find this utility under the Applications > System Tools > System Monitor >
selection from the Desktop toolbar menu,
as shown in this screenshot.

This process invokes the LINUX System Monitor,
a very powerful utility with a wide range of options on performance data to display.
The next three selections are typical screens of information.
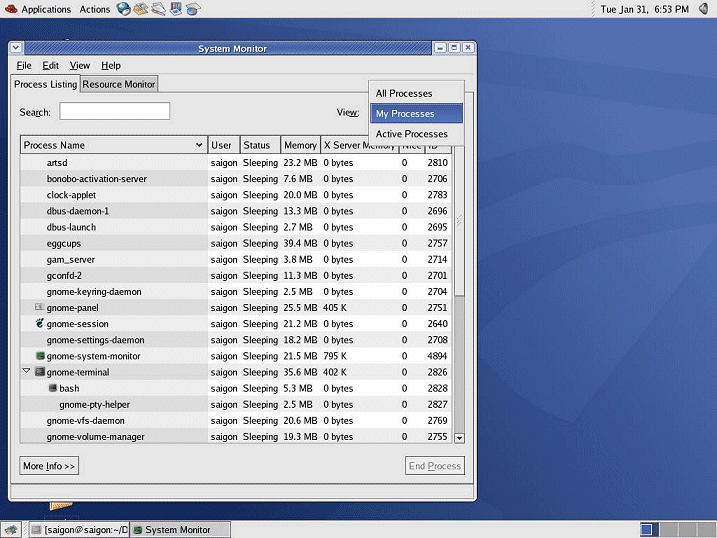
- Study Performance Data #1.
This display shows the values of selected X server Memory and Processes allocations
as a function of time.
In this example you are looking at the the Average
Memory size, and the activity status of processor utilization.

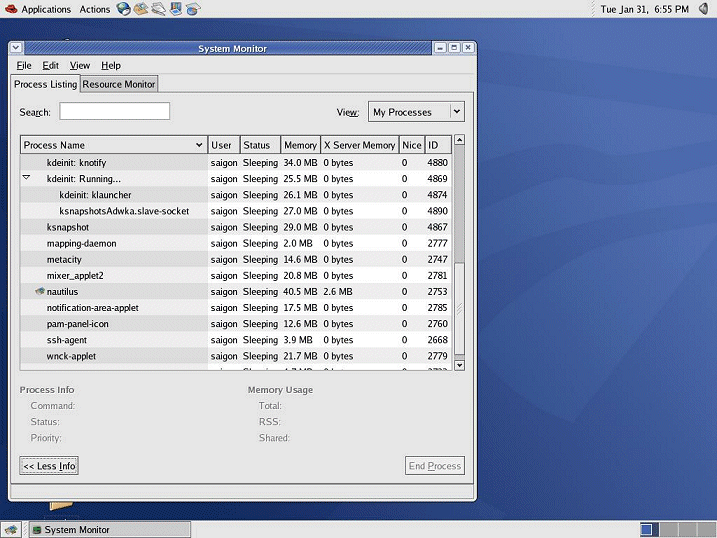
- Study Performance Data #2.
In this example screenshot you are looking at "More info"
summaries available,
for Process info and Memory Usage values.

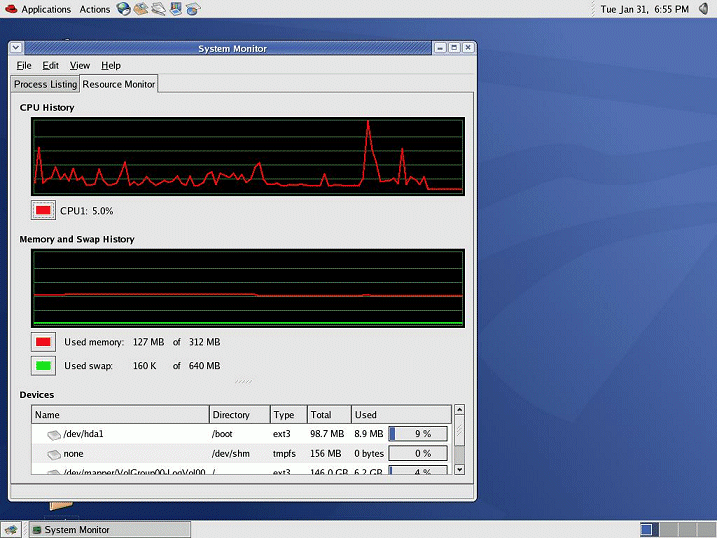
- Study Performance Data #3.
Here the same data is graphically presented so that you can
determine peaks in CPU memory consumptions as they change.
