|
|
Explanations
The charts below show the response time in the database dependent
part of a script playback as a function of the total number of
BUs running at one time.
This data was collected as part of the
Mobile Agent Loading Experiment,
in which a simple test was done of a mobile agent to assess
response time as a function of load.
First Chart
The upper chart was generated three weeks before the lower chart.
During that period the website owner made a number of changes
to improve performance.
Second Chart
The lower chart shows the same test script,
running for approximately the same duration, on the same application,
a few weeks after the first test.
To a first approximation it appears that the capacity of the application
has increased by approximately 50%.
Third Chart
The third chart was generated four months after the second chart.
By this time the actual website had been migrated to a "production" site.
It appears performance has degraded somewhat in the initial levels
of load, but seems to be more consistent at higher loading levels.
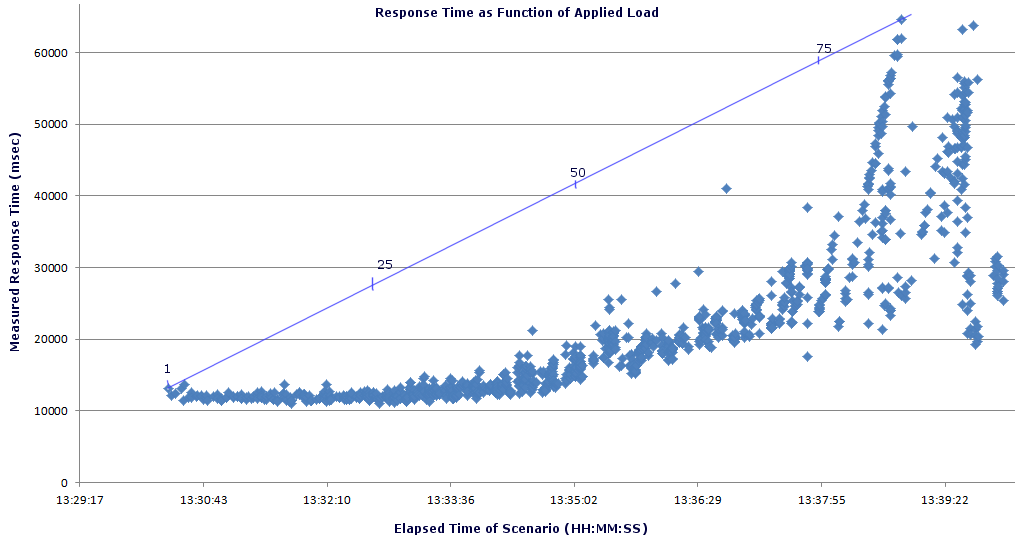
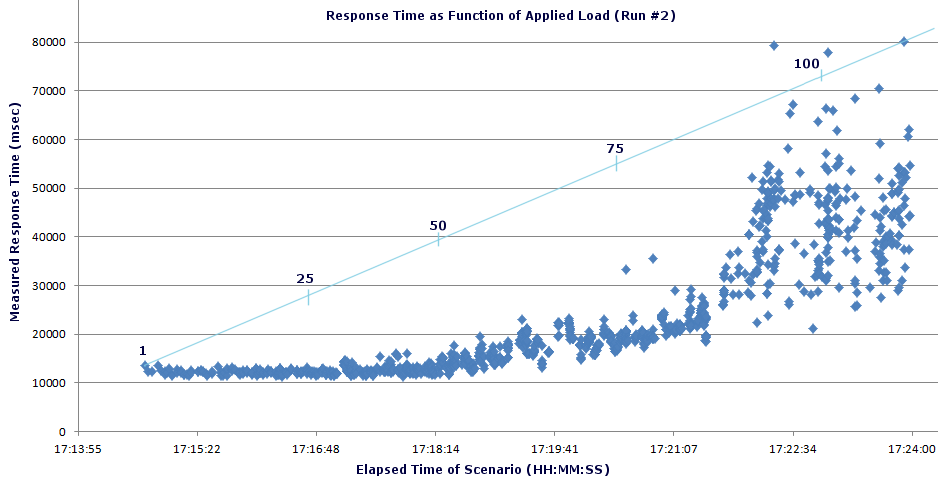
Chart 2: Performance Three Weeks Later
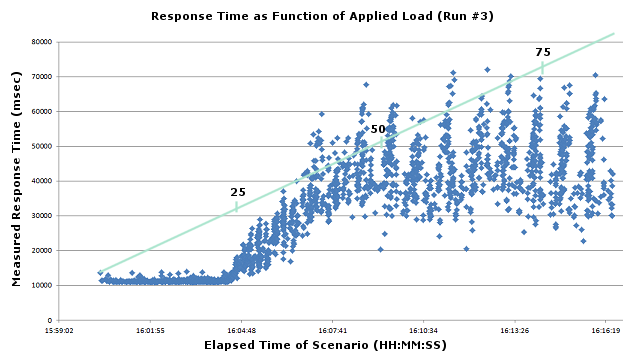
Chart 3: Performance Four Months Later