|
|
Summary
In this demonstration experiment we ran 1[1]100 BUs in parallel against
an AJAX site that is heavily used by smartphone clients.
The site provides schedule access to a public transportation system in a
metropolitan area.
The results show a degradation in performance from the server
side at around 85 Browser Users (BUs) in parallel.
Playback Script
In this experiment we ran the following eValid script against the
target website, in which eValid is set up to behave like an iPhone 4:
This script uses the internal time for each BU process to measure how long the information request to the site took, including the time for the AJAX delivery of the data to stabilize in the browser face. The phone has GPS capability, so the data reported depends on the location of the phone at the time the request was made. (It apparents defaults to a central station absent GPS details, which were not being sent in this test.) The script then records that time in a local file for later processing (see description of data chart below).
Scenario Description
The scenario used in this test was based on the idea that each
playback takes about 15 seconds of elapsed time.
The launch sequence added a new BU to the composite load at the rate of one new BU every 3 seconds, so that after ~300 seconds all 100 BUs would be running in parallel. This is reflected in the eValid LoadTest Script. The repetition count was set to 50 -- each BU would replay the test script 50 times in a row -- so that the scenario could run for a short length of time at a full 100-BU wide level.
LoadTest Summary
Here is the
LoadTest #1 Summary Report
that shows the results of the test at the end.
The earliest-launched BUs ran ~30 times, and the latest launched
BUs (at the bottom of the table) ran up to 3 times.
The script completed 1,419 times in the 10:06 minute long scenario.
The data volume on the AJAX part of the playback
(the section where the timing was done)
was 329.1 KBytes per cycle.
In effect, as you look at the data from User Number 1 through User Number 100, the load is increasing linearly, and the average playback time increases as well, due to the increased load.
The data volume to the mobile device is very small so saturation of the I/O channel due to overload from all of the activity is not a factor in the slowdowns.
LoadTest Chart
Here is the
LoadTest #1 Chart
that shows the range of overall playback time values for all
of the BUs running in parallel.
Note that the number of data records involved for each BU running
decreases as you move to the right of the chart.
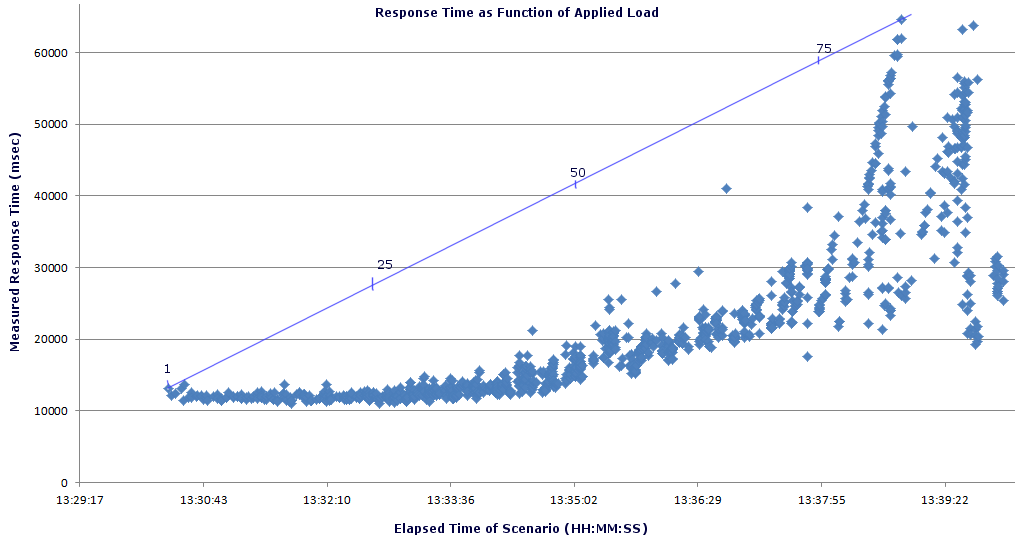
Chart of Playback Times
Here is a chart of the specific timed sub-sequence in the script
as a function time of data collection.
The scenario started at 13:30 and required almost 6 minutes to build up to 100 simultaneous BUs. After the driver machine driver stabilized we kept it running for an additional 5 minutes and then stopped the scenario manually. As the reports above show, we collected data from the test executions for a specific section of the playback script, namely the passage that involves collection and display of schedule information. (Click for the full-size image).
Conclusion
If as few as 100 simultaneous requests
for this mobile service are made concurrently,
the average delivery rate of data decreases by 3X or more.
The data in the chart also suggests that the simultaneous capacity of this server setup to keep performance within 2X from the base rate is about 50 users.