|
|
Introduction
This demonstration consists of eValid running a number of scripts
on a prototype monitoring appliance, with result data displayed via Nagios.
eValid Script
Here is the script... |
eValid Playback Custom Log File
Here is the script... |
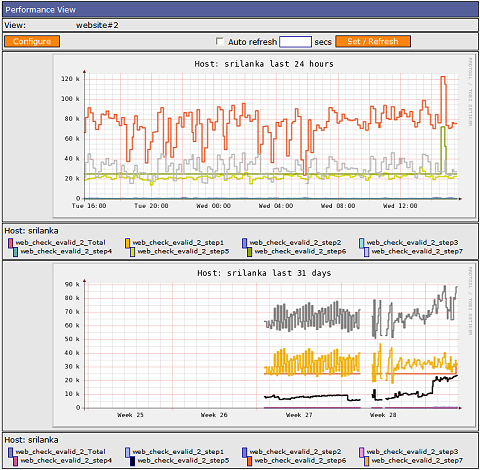
Nagios Report Display
The standard Nagios report shows the prior 24 hour and the prior 31 days results of running the
particular test.
Each step in the test is given a separate color in the display.
The total time consumed by the test is always identified first.
Note:
The distinguishing color selections that identify the time series data for
separate events in the script vary depending on the type of chart used.
|
|