Your e-Business Quality Partner eValid™ -- Automated Web Quality Solution
Browser-Based, Client-Side, Functional Testing & Validation,
Load & Performance Tuning, Page Timing, Website Analysis,
and Rich Internet Application Monitoring.

eValid -- PageSpeed Procedure

Summary
The eValid PageSpeed procedure is a quick and easy way to determine number of and speed of individual page components.

  1. Starting Page
    Choose the starting page you want to analyze in detail. Use the eValid address bar to type in the desired address, or use eValid as a browser to navigate to the page where you want the analysis done.

  2. Beginning Recording
    Click the red dot to start recording:

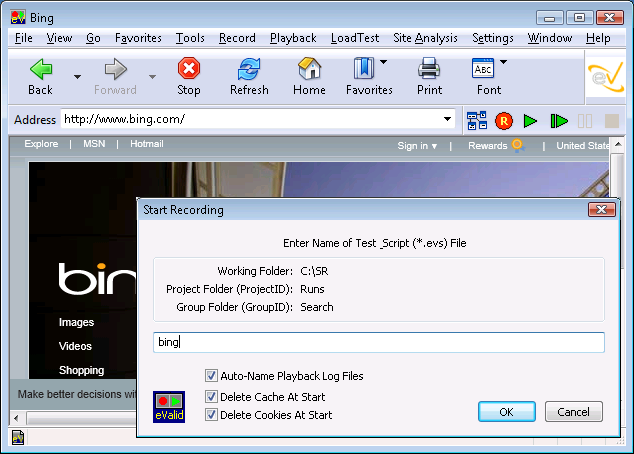
    You will be asked to name the test script file.

  3. Resulting Test Script File
    Here is where eValid stores your test script.

  4. Confirmation of Script File Location
    eValid stores your script in the location shown.

  5. Select Detailed Timings Output From Settings
    Make sure that the "Detailed Timings" settings is checked, as shown.

  6. Playback Data Dialog Selection
    Press the green button on the eValid browser face to start the playback.

    Wait a few moments (depending on how big the page is) while the playback completes.

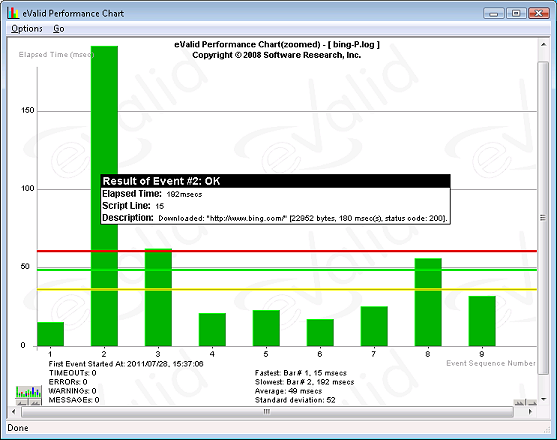
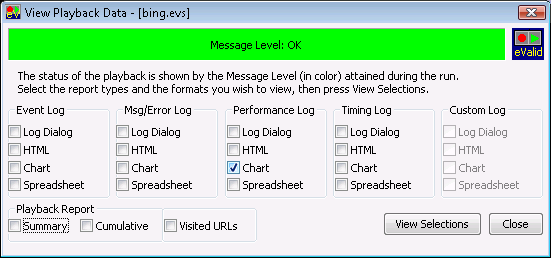
    When the playback is done you will see the View Playback Data Dialog. Select the Chart option in the Performance Log section, as shown. (You are free to look at all of the other available eValid reports from this playback, but the main one you want is the Performance Log Chart.)

  7. Consolidated Chart
    The leftmost column in this chart shows the individual page components, one green region (light green or dark green, alternating) for each component. Hover over one region to read the statistics that eValid has collected about the download properties of this page component.

    The www.bing.com page took 180 msec (0.18 sec) to download, and its size was 22,952 bytes. The page components are shown in the order of complete arrival, starting at the bottom of this "stack chart."

  8. Expanded Chart
    If you click on ANY region in the above chart, it will expand to the form shown here. Each separate page component is shown as a single column, in the order in which their download is completed. (You can scroll the display to the right if there are too many items on the graph.) Here the screenshot shows that we have hovered over the same element as we did in the above screenshot.

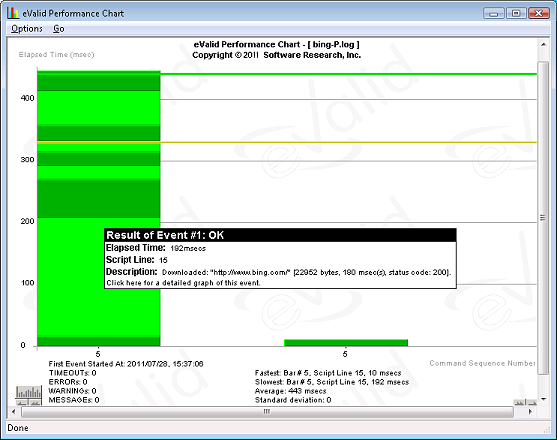
    The www.bing.com page took 180 msec (0.18o sec) to download, and it size was 22,952 bytes.